TEI on GPU: Part 2: A Queue in Hand is Worth Two Anywhere Else
09/02/2026
In Part 1, I showed you how my GPU TEI backed processed 100 requests in 1s, while my CPU backend took over 200 seconds to process the same batch of requests.
GPU wins.
Thanks for coming to my TED talk.
But of course that’s not the entire story. It gets more interesting.
I added a semaphore to limit concurrent requests to 4 at a time. The GPU got slower. The CPU got slower.
But then, everything made more sense.
This article is about control surfaces. About deciding where your bottlenecks live. And about the difference between “fast” and “predictable”
What Changed
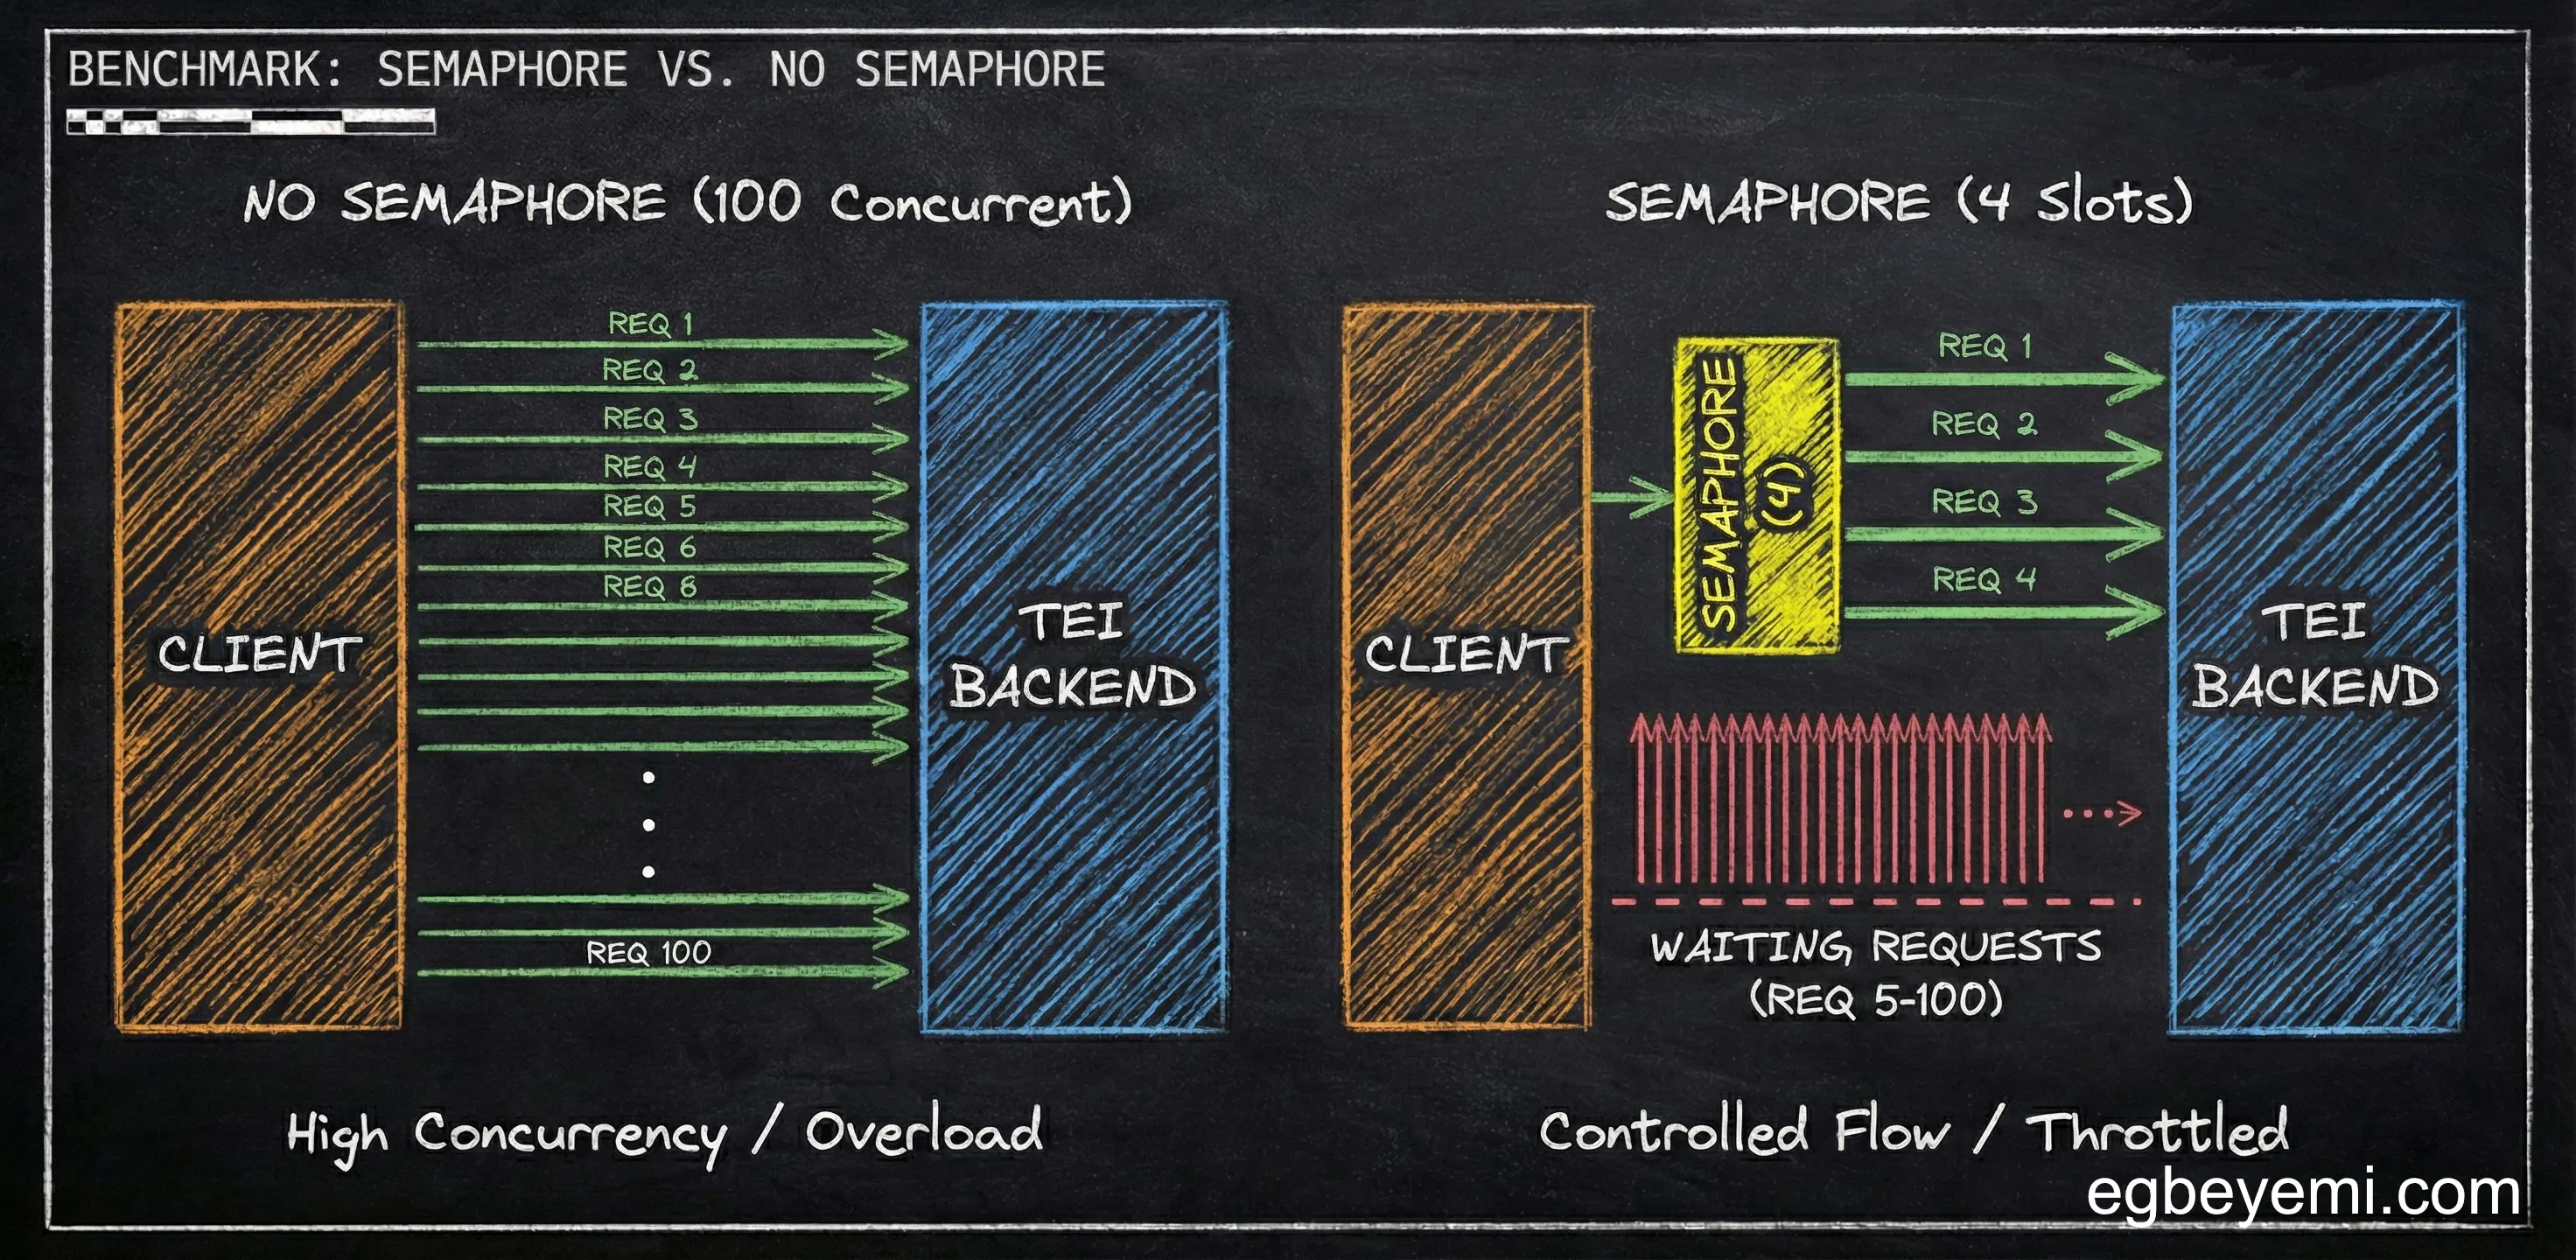
No Semaphore (from Part 1): Fire all 100 requests at TEI, let it handle the queue.
With Semaphore (this article): Client holds a semaphore with 4 slots. Only 4 requests can be “in flight” to TEI at once. The others wait their turn in the client.
This sounds like it would make everything slower. After all, we are artificially limiting concurrency. We are forcing a queue in the client, in addition to the queue in the TEI backend.
The Numbers (CPU Edition) - The Dramatic Change
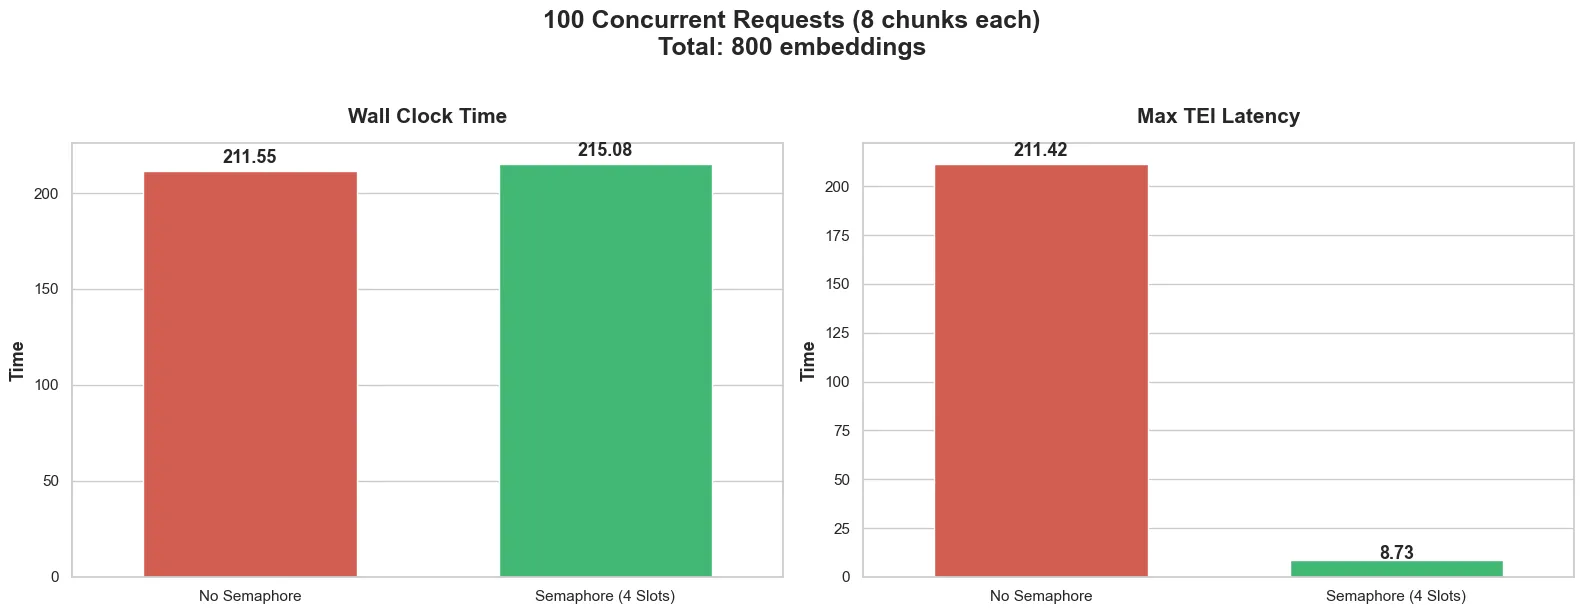
Without semaphore:
- Wall clock time: 211.5 seconds
- Max TEI latency: 211.42 seconds
With semaphore:
- Wall clock time: 215 seconds (4 seconds more—basically the same)
- Max TEI latency: 8.7s (collapsed from 212s)
So wait. The total time barely changed 212s → 215s, but TEI’s max latency collapsed from 212 seconds to 9 seconds?
Indeed. And that’s the whole point.
The Queue Simply Moved
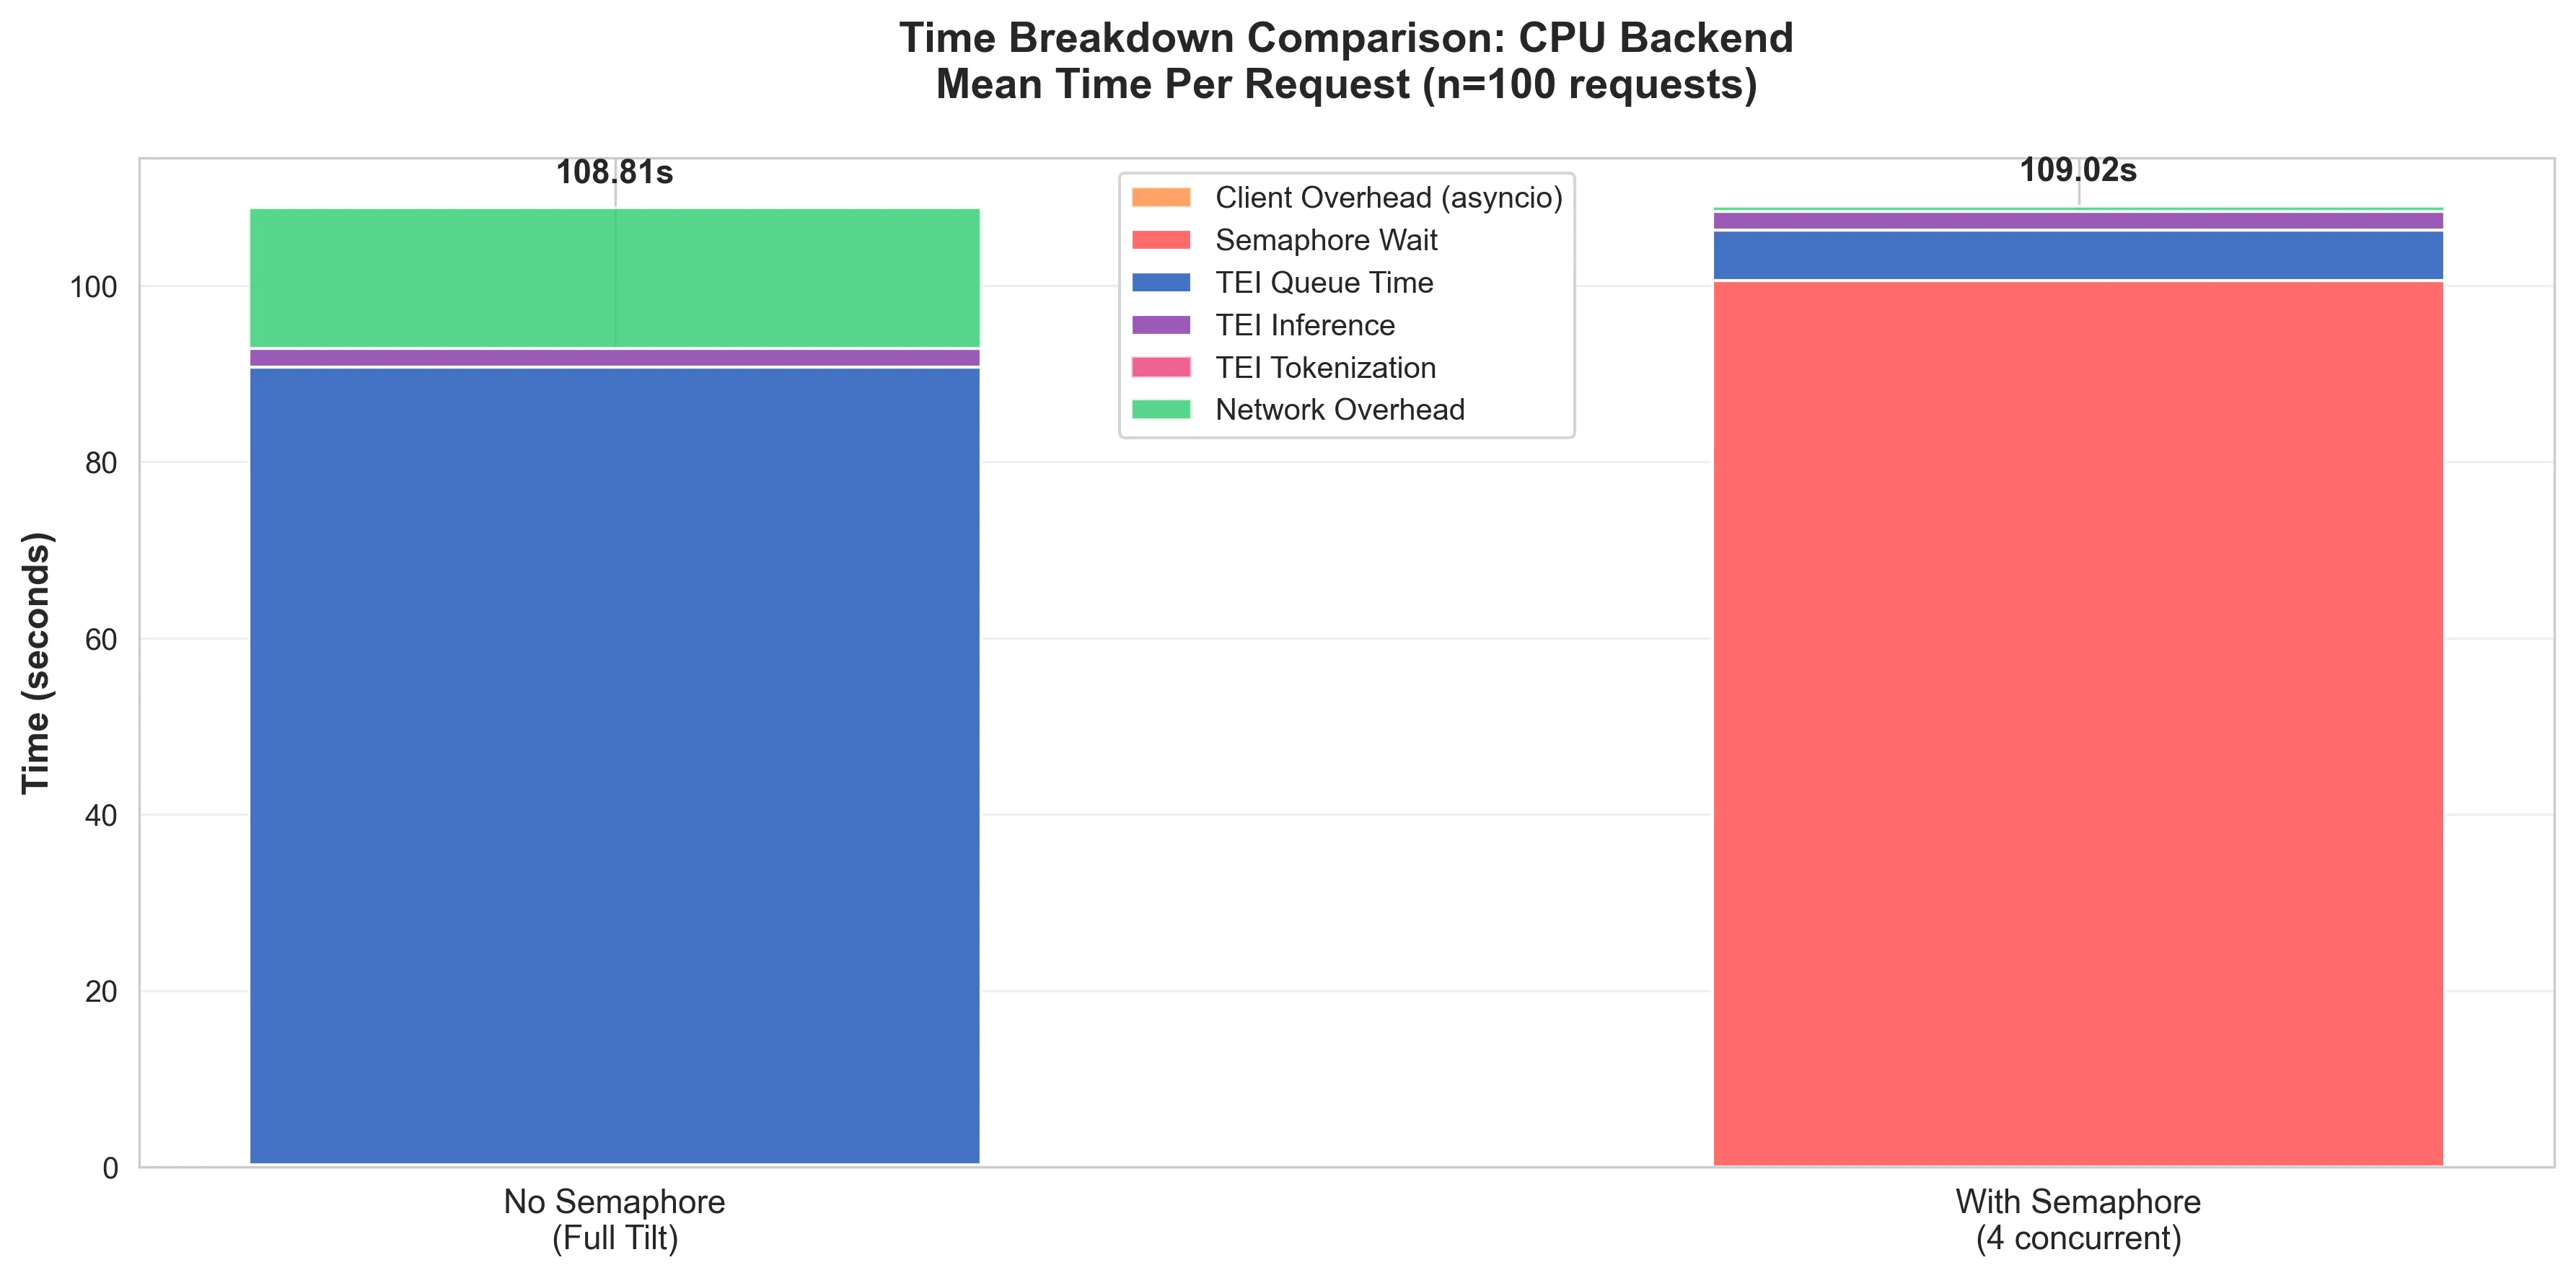
Without the semaphore: Requests spent on average ~92 seconds at TEI (mostly queue time) and ~2 seconds processing.
With the semaphore: Requests spend ~8 seconds at TEI (queue + processing), but they wait up to ~100s on average at the client for a semaphore slot.
Same total time, but queuing is at a completely different location.
Why does this matter?
When requests queue at TEI, they consume resources at every layer:
- Client: Open HTTP connection, async task waiting
- OS: Socket in ESTABLISHED state, buffer memory allocated
- Load balancer: Active proxy connection, timeout tracking
- TEI: Request in memory queue, worker thread allocated
All of these resources are held for the entire queue time, and that 100th request held all of these resources for the ~212 seconds it took to complete.
You can imagine that it would not take a lot more than 100 concurrent request for certain parts of the layers to start timing out.
However, when requests queue at the client with a semaphore, they consume:
- Client: Async task waiting for a semaphore slot
- Everything else: Nothing. Request hasn’t been sent yet.
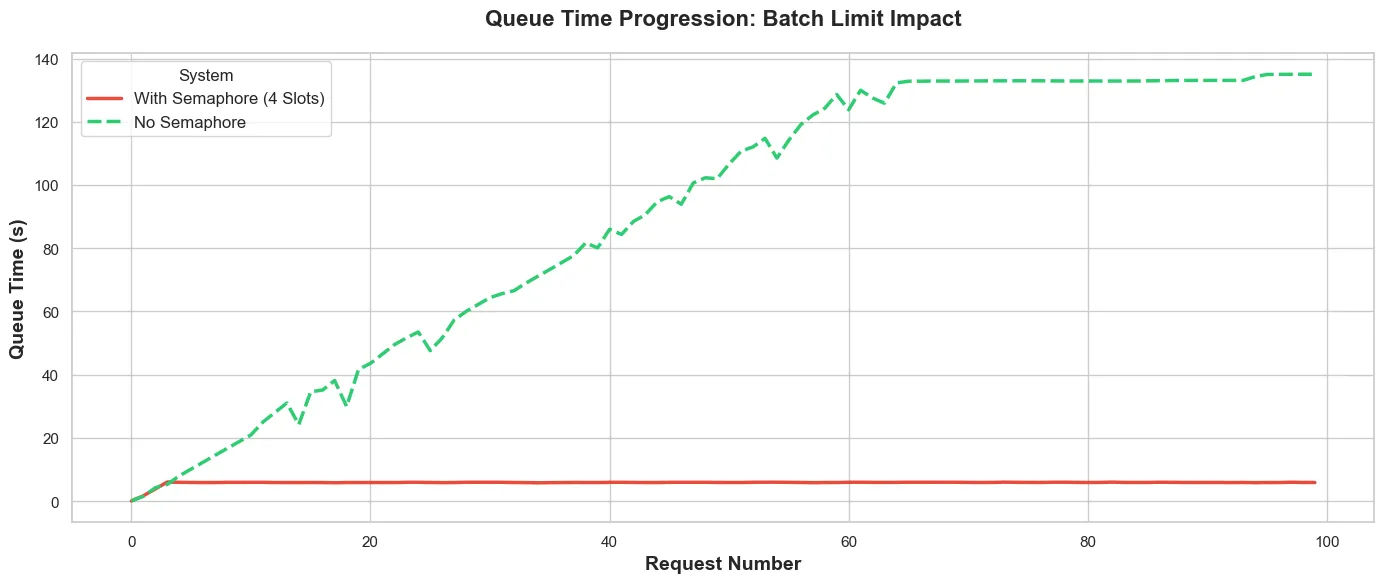
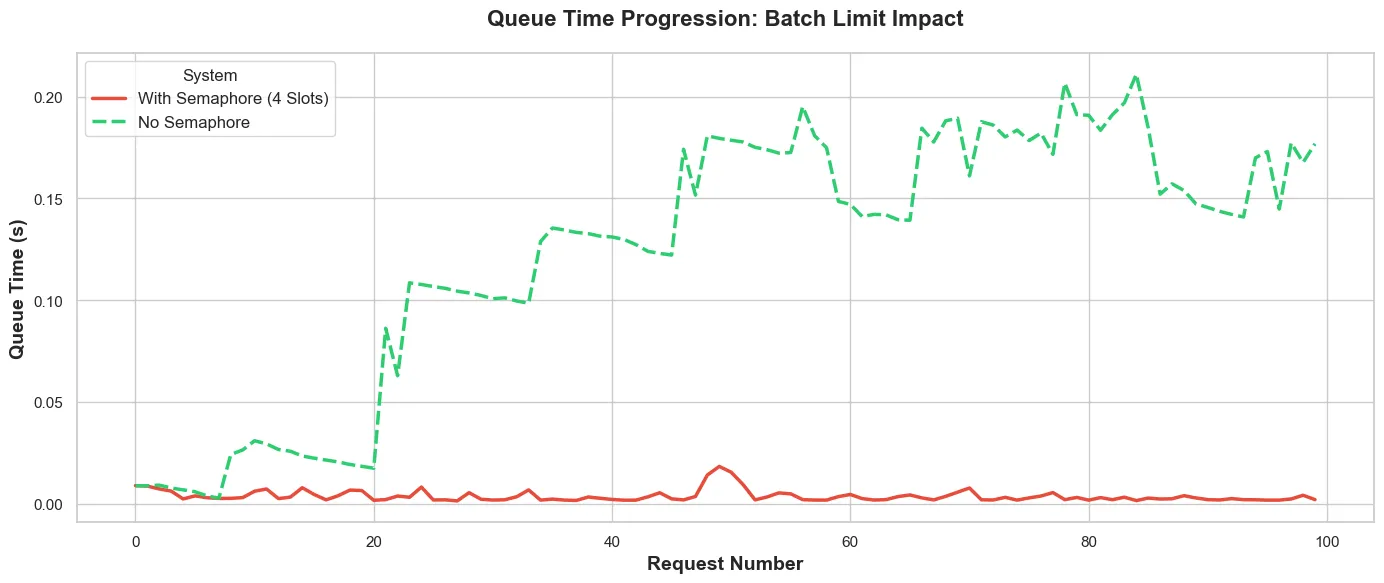
Fig. 3 shows how the queue time increases in the TEI backed vs the number of requests.
- Without the semaphore (green dashed): The queue builds pretty linearly as more requests come in—building up to about 140s, where it reaches saturation. At this point, the TEI backend is at max capacity, and every new request waits the full queue time.
- With Semaphore (red solid): We have a flat line at ~8 seconds. Queue at the TEI never builds up because only 4 requests are in-flight at once. The semaphore prevents queue buildup.
The semaphore moves the queue from TEI (green climbing line) to the client (not shown in fig. 3. As a result, requests remain with the client until there is capacity to handle it. No open connections. No wasted resources. No timeout worries.
This then makes it easier to implement retries/timeouts/priority processing. You hold all the cards.
The Numbers (GPU Edition) - Overly Defensive
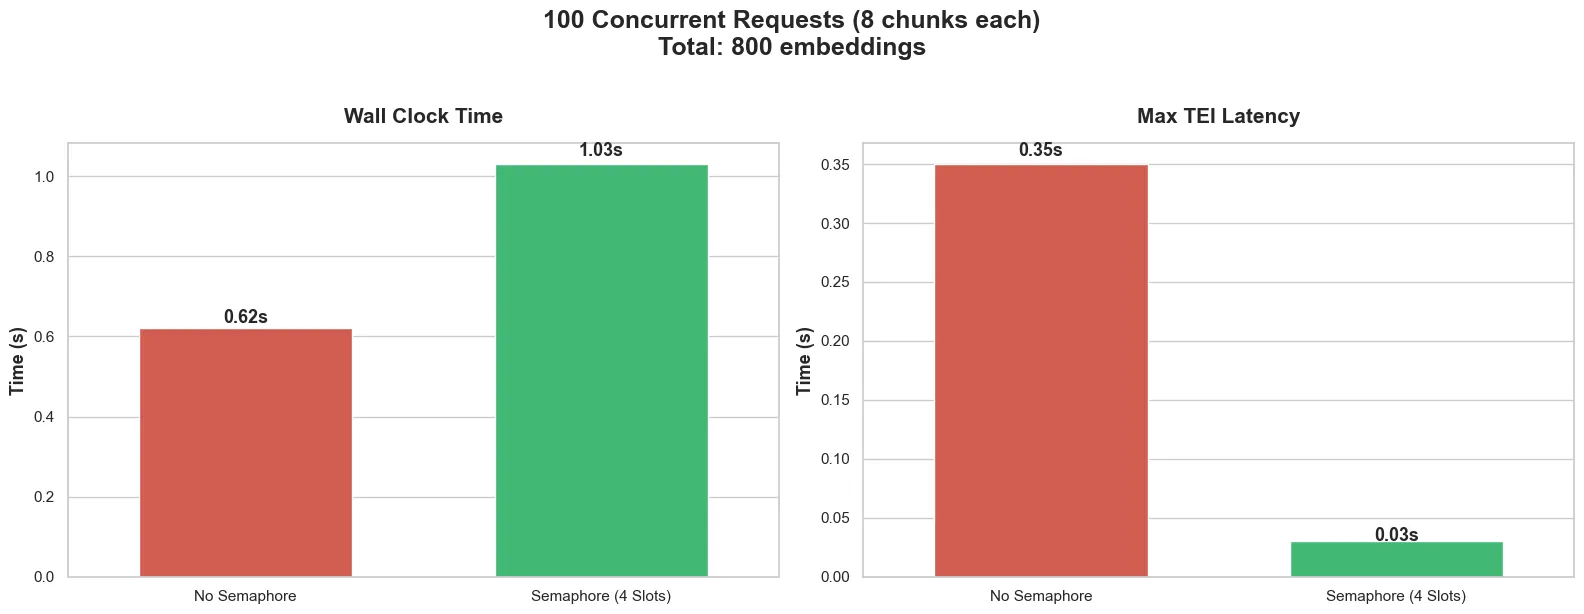
Without Semaphore:
- Wall clock time: 0.62s
- Max TEI latency: 0.35s
With Semaphore:
- Wall clock time: 1.03s (almost double!)
- Max TEI latency: 0.03s (also went down)
So just like in the CPU case, the wall clock time went up, but the TEI latency came down.
What The Semaphore Reveals
The GPU was processing requests so fast (0.62 seconds for all 100) that its behaviour was essentially invisible. That 0.35s TEI latency? It includes some minimal queueing as requests arrived in a stampede.
With the semaphore, requests arrive in controlled waves of 4. TEI never sees a stampede. The 0.03s latency is almost entirely pure processing time with essentially zero queue.
Of course the extra half a second of wall clock time can be attributed to semaphore acquisition overhead.
Over 100 requests, wait your turn → get a slot → return the slot adds up. The GPU processing is fast enough that it’s hard to notice at 100 requests, but 1,000? 10,000? At some point it will become nontrivial.
While the semaphore is very useful for controlling the the flow of requests, a mis-tuned semaphore will do more harm than good.
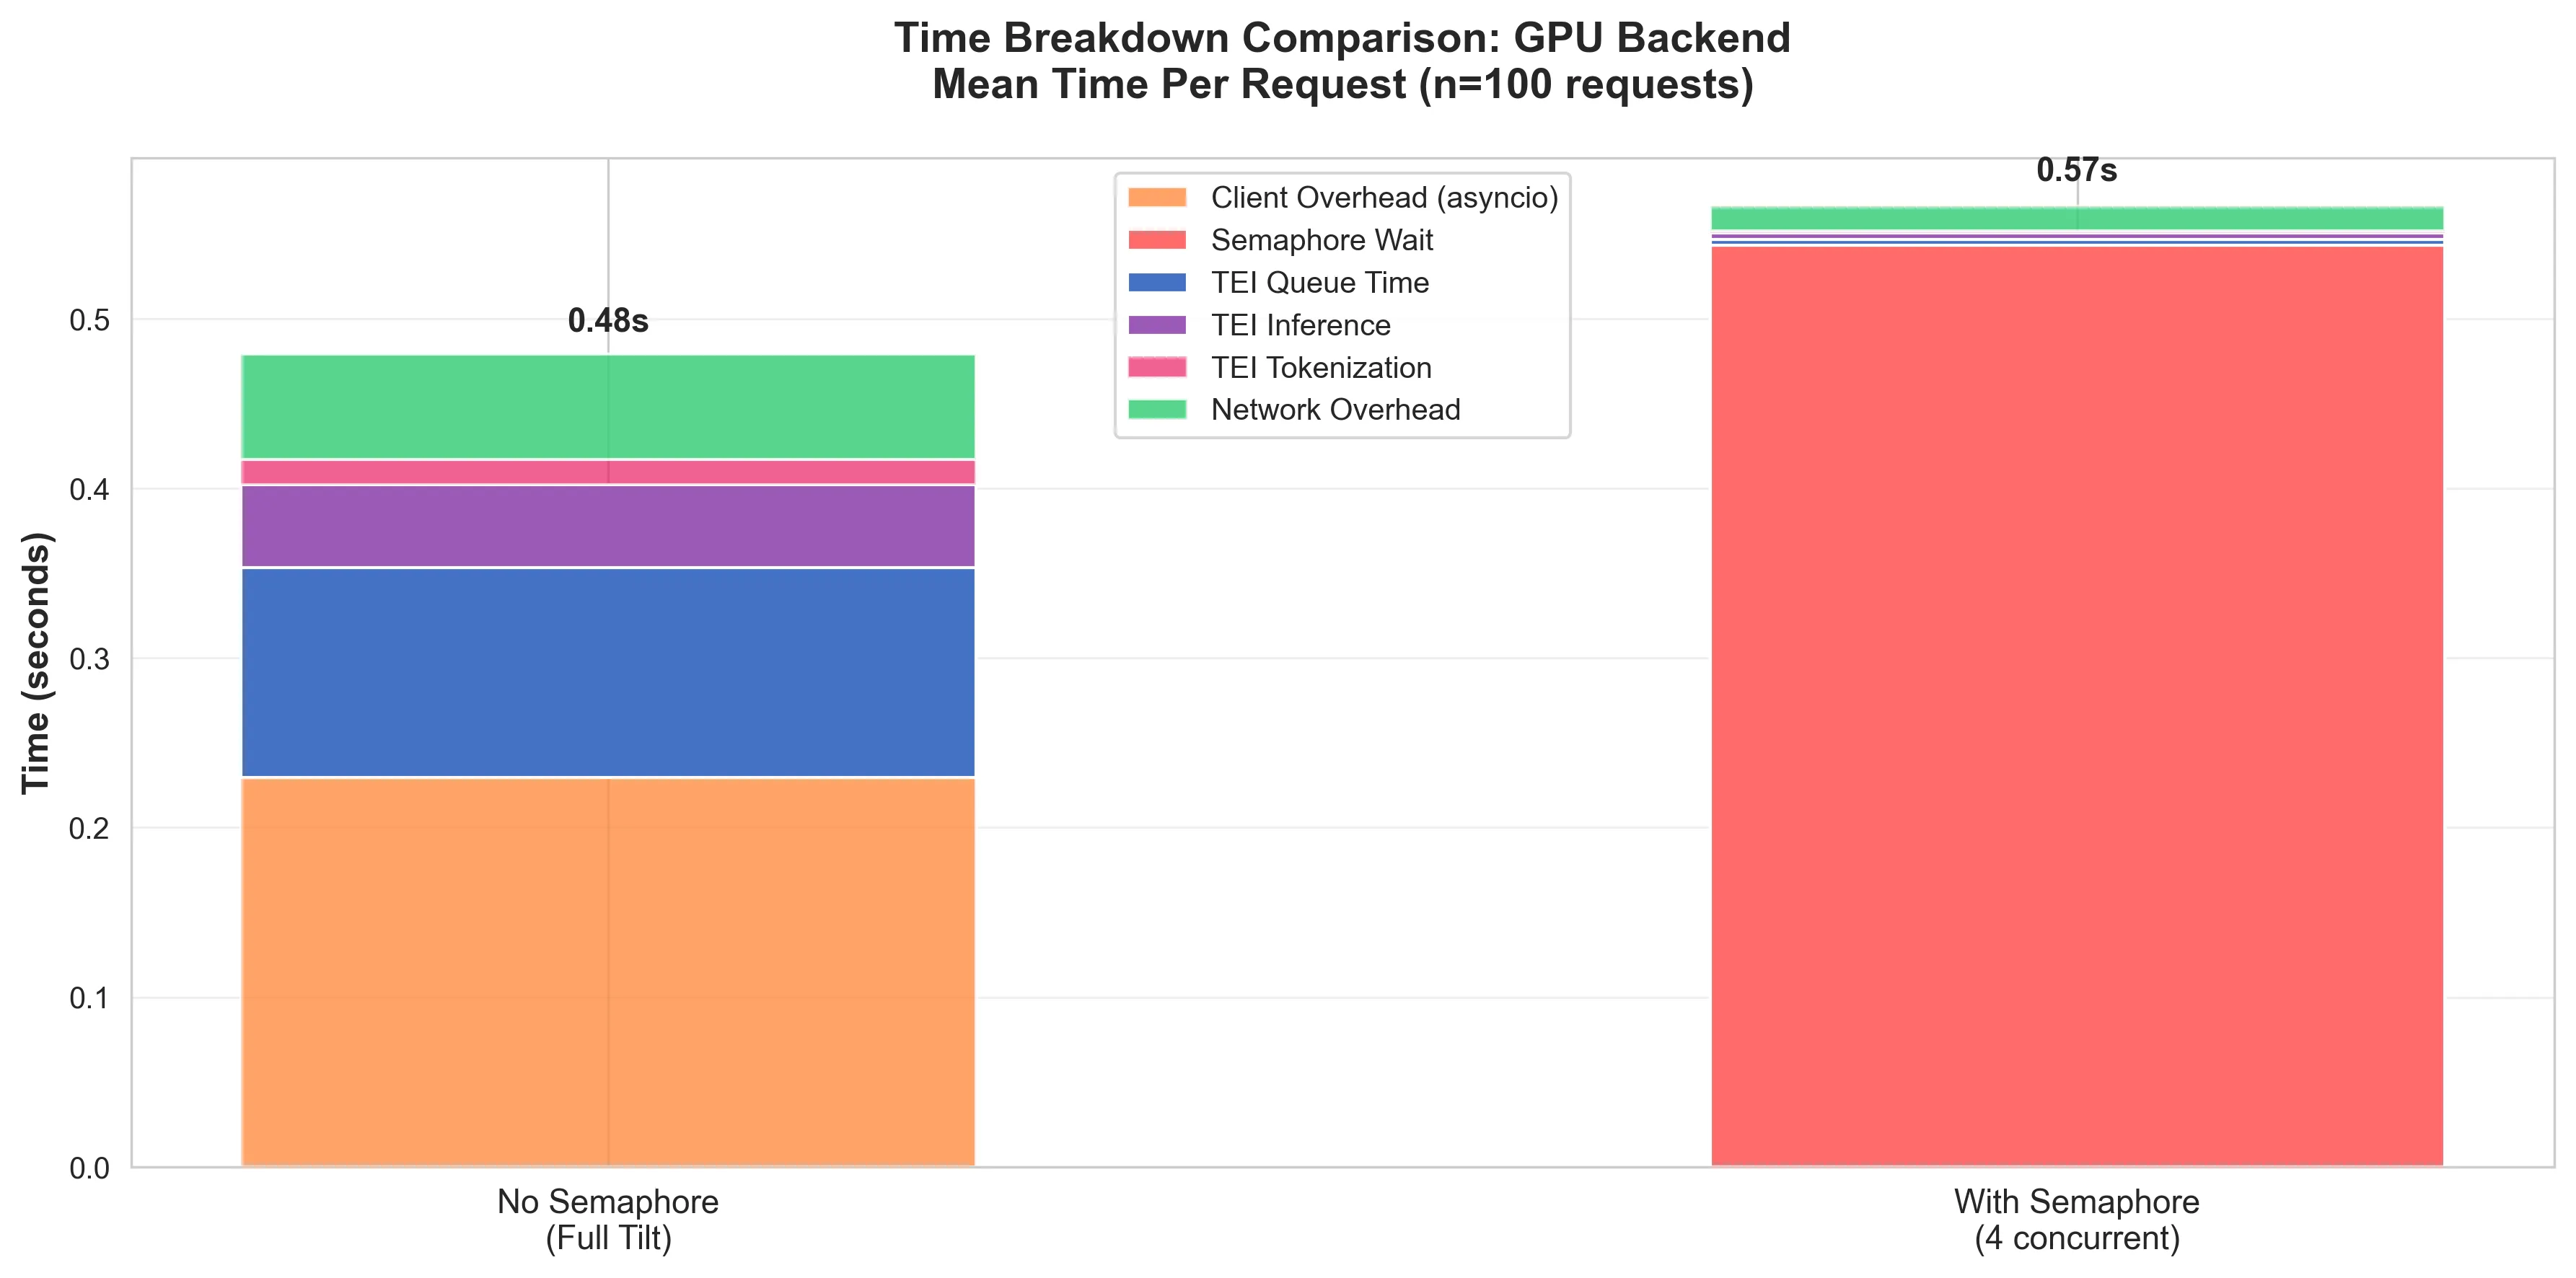
The ‘With Semaphore’ bar in fig. 5, shows that while the queue time in the GPU was reduced to almost nothing, the resulting queue in the system leads to a comparatively considerably worse performance than without.
This doesn’t mean “do away with a semaphore”, it just means “give the semaphore more slots!”. The GPU can handle it. And at scale, when the number of requests starts approaching the saturation point of the GPU backend, you have the semaphore there controlling traffic.
The GPU Does Queue
Without the semaphore (green dashed line), the GPU does queue, even though the queue time is in the order of tens of milliseconds. The stepped oscillation pattern sugests the GPU is hitting some kind of micro-batching or scheduling effect. Possible explanations:
- Time-slicing artefacts: The GPU here is time-sliced, so this might be causing scheduling contention.
- Batch processing windows: TEI might be doing internal micro-batching that creates these waves.
- CUDA stream scheduling: The GPU might be context switching between concurrent effects.
- GPU warmup: The first ~20 requests are cold start before the GPU scheduler kicks in.
With the semaphore however, the queue time progression is a nice flat ~10ms. That predictability can be very useful at scale.
Bonus Insight (The GPU Warm-up Effect)
From the data, I observed that with the semaphore, the inference time was shorter for requests that arrived later to the GPU.
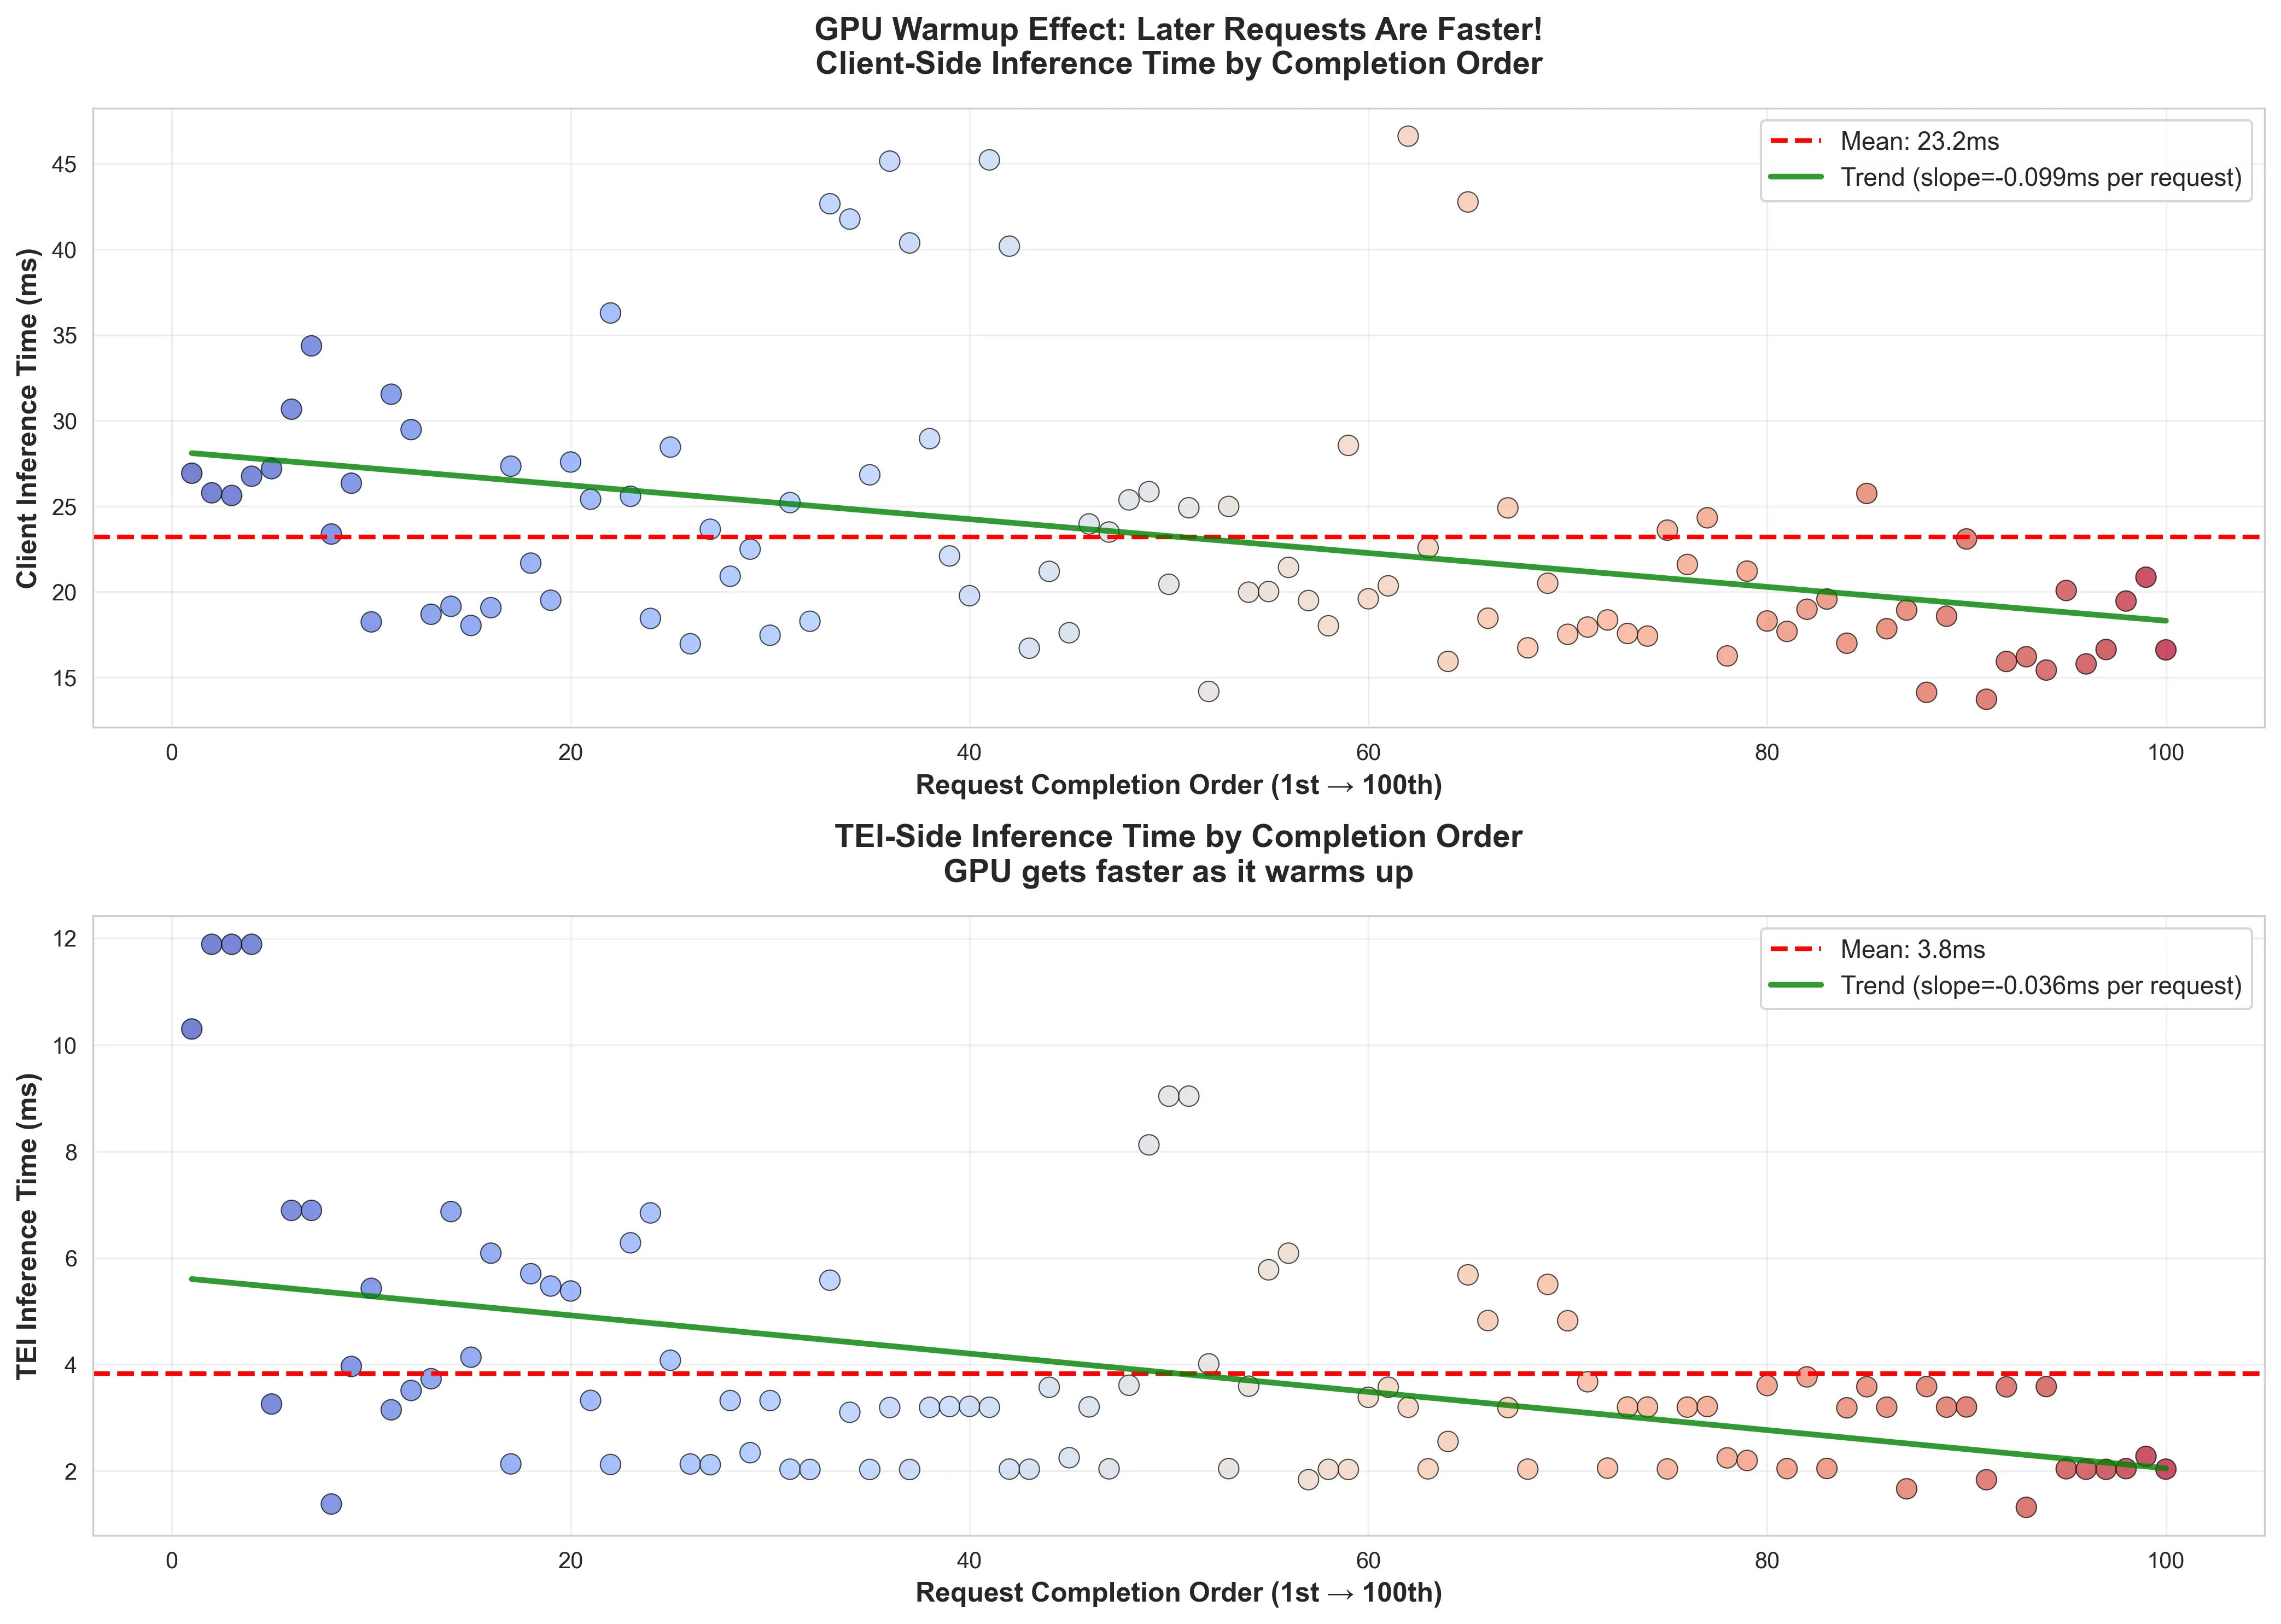
Looking at the wall clock time (the client side latency) the same trend can be observed. This shows that there is a very small penalty to pay when requests hit a cold GPU. Of course the latency penalty is some ~8ms in this case, but it’s an interesting effect to note.
Learnings (Part Deux)
Part 1 taught me: GPU is faster, but raw speed is not the entire solution to burst traffic problems.
Part 2 taught me: Where your queue lives determines what fails first.
The semaphore didn’t make my system faster, but it made it understandable. I gained insights that I would not have been able to see properly till I slowed things down.
For CPU the wall clock time stayed largely the same (211s → 215s). For GPU, it actually got slightly slower (0.62s → 1.03s from coordination overhead).
What did change however, was resource consumption:
CPU Backend:
- Without semaphore: 214 seconds of TEI queue time = 214 seconds of held connections across every layer of the communication stack (OS, Ingress, TEI).
- With semaphore: 8 seconds of TEI queue time, the rest waiting at the client for a slot.
GPU Backend:
- Without semaphore: 0.1-0.3s of micro-queueing from concurrent stampede.
- With semaphore: 0.03s pure processing time, no internal contention
Same work, but different failure modes.
Without the semaphore, even though the TEI backend handles back pressure very well, resource exhaustion when you have a lot of held connections can occur anywhere.
The GPU backend handles it, but with unpredictable latency spikes from internal scheduling.
With a well tuned semaphore, both backends have bounded resource usage. The CPU remains slow, but predictable.
Fast hardware increases capacity, but good architecture makes capacity predictable and sustainable.
Implementation Notes
Knowmeld is a distributed system with asynchronous task management, so the semaphore used is a pretty simple:
ACQUIRE_LUA = """
local key = KEYS[1]
local max = tonumber(ARGV[1])
local token = ARGV[2]

local count = redis.call("SCARD", key)
if count < max then
	return redis.call("SADD", key, token)
end
return 0
"""


class RedisDistributedSemaphore(Semaphore):
    """Semaphore that uses Redis as a distributed lock."""

    def __init__(
        self,
        key: str,
        max_slots: int,
        redis_client: Redis,
        poll_min: float = 0.02,
        poll_max: float = 0.10,
    ):
        super().__init__(key, max_slots, poll_min, poll_max)
        self.redis_client = redis_client
        self.acquire_lua = redis_client.register_script(ACQUIRE_LUA)

    async def _acquire(self, token: str, deadline: float) -> Lease | None:
        """Acquire a semaphore slot waiting up to the timeout seconds."""

        added = await self.acquire_lua(
            keys=[self.key],
            args=[self.max_slots, token],
        )
        if added == 1:
            return Lease(token=token, key=self.key)

        return None

    async def _release(self, lease: Lease) -> None:
        """Release the semaphore slot."""
        await self.redis_client.srem(self.key, lease.token)
That’s pretty much it. Just a few lines of code changes the behaviour of a distributed system under load.
Of course implementing a semaphore isn’t the hard part. The hard part is:
- Choosing the right concurrency limit: Too low → wasted capacity. Too high → resource exhaustion.
- Handling client-side timeouts: A few requests over 100 to the CPU backend certainly requires timeout/retry logic.
- Making the wait visible: Users need progress indicators.
But these are good problems. Easier to reason about because you control the queue.
What’s Next For Me
I already have this deployed to production for Knowmeld. I have both document indexing/query encoding running on GPU because why the hell not.
But with this information, I know that when we have the amazing problem of exceeding what our current GPU capacity can handle, I know just how to mitigate it.
Want to talk about Software/AI Infrastructure?