TEI on GPU: 200x Faster Than CPU (Part 1: How do you like your Queues?)
02/02/2026
Knowmeld runs two self-hosted Text Embeddings Inference (TEI) instances on CPU—one for indexing documents, the other for embedding queries. When I was the only user, performance was acceptable. Documents indexed reasonably fast, and separating indexing from queries meant that search remained responsive.
Then I onboarded a few test users.
The bottleneck appeared immediately. Multiple users uploading documents simultaneously meant requests started queueing. The time to index documents ballooned, which meant that it took longer for changed documents to become searchable.
The system that felt fine for one person started showing cracks with three.
I knew migrating to GPU would improve request handling time. I expected it to blow the CPU setup out of the water. What I didn’t expect was what I learned about where bottlenecks actually live in distributed systems.
The benchmarks were eye-opening. Of course GPU was faster—that’s why they require a blood sacrifice to buy.
But “faster” is not the entire story.
This is part 1 of a two-part series on what happens when you actually measure infrastructure instead of only relying on intuition regarding how it works.
The Setup
As mentioned, Knowmeld handles embeddings through two TEI instances—one for indexing documents, and the other for embedding queries. Both running on CPU nodes.
Query embedding is usually very quick, because queries are oftentimes very short.
I did not measure the time it took to embed queries on CPU, but indexing documents took about 2s for a batch of 8 chunks at 500 tokens per chunk.
500 tokens and 8 chunks?
The model we use for embedding is one of the bge-x embedding models from BAAI. It has a hard token limit of 512 for embedding a chunk.
When running TEI on CPU, it has a hard cap of 8 on the number of chunks that can be processed in a single request. This means that a document that is longer than 4000 tokens will require multiple requests to embed.
After adding a GPU node to my K3s cluster, I had an RTX 4080 Super rearing to go with 4 time-sliced GPU slots available. Time to see what it could actually do.
Test parameters:
- CPU Backend: 3 vCPU, 5GB RAM, max batch size of 8
- GPU Backend: Same resources, RTX 4080 Super time-sliced, batch size of 8
- Test: Same 4k token document chunked into batches of 8, sent 100 times concurrently
- Goal: Measure real performance beyond “GPU is faster”
I wrote a short python script to embed the docs concurrently. I then scraped the TEI logs to get the actual processing time. In addition, I measured the time taken from the client’s perspective (wall clock time), and collected TEI’s internal metrics (queue and inference time).
Benchmark 1: Full Tilt (No Traffic Control)
First test: send all 100 requests at once. No rate limiting, and no back-pressure management. We spray all the requests at the TEI backend and let it handle queueing however it wants.
This is how things are run in development, and certainly how things break in production.
The numbers were astounding
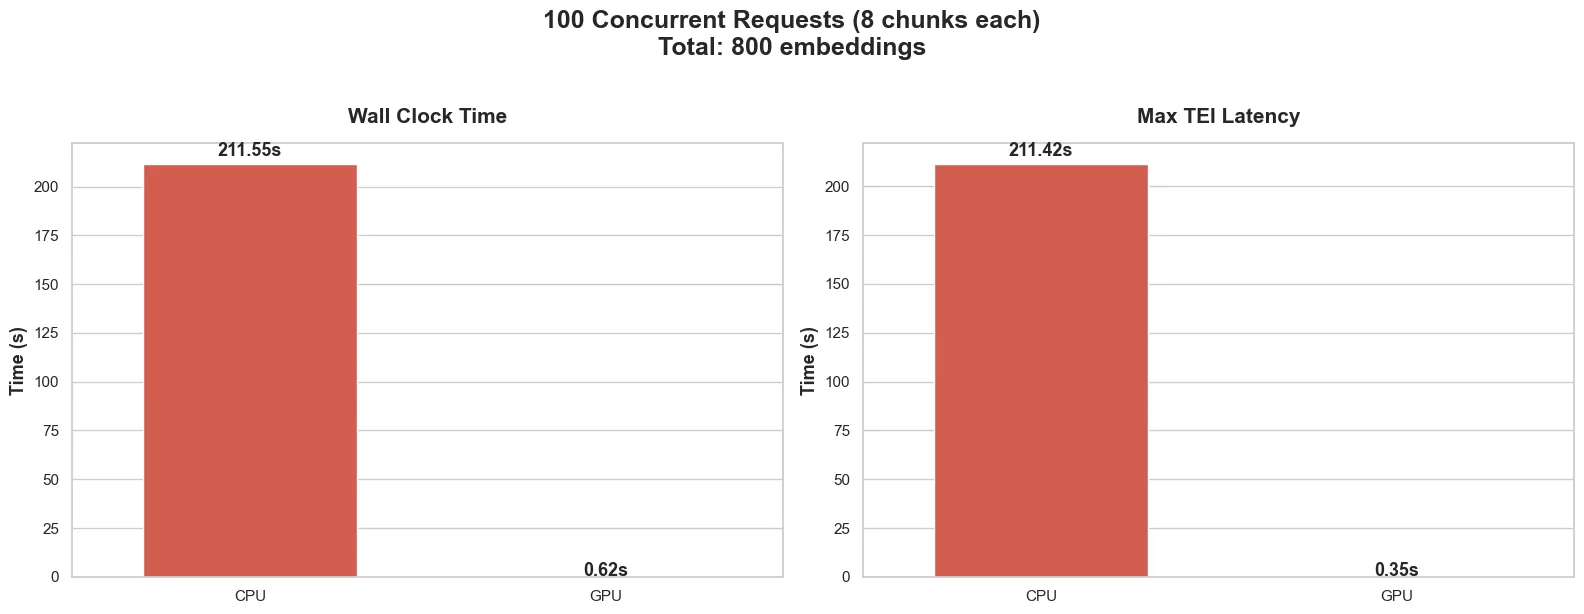
From the client’s perspective:
- GPU: Took 0.62s to process all the documents
- CPU: Took 211.55 seconds to process all the documents
And in the TEI backends:
- GPU: Took 0.35s
- CPU: Took 211.42s
Measuring the time taken from the logs in the TEI backends, we can see that majority of the time taken to handle the requests was spent with the TEI, well, handling the requests.
The max request latency refers to the time taken to process the final request, as it includes the time it took that request to wait its turn.
Quite impressive, and as expected, the GPU backend chewed through all 800 chunks in less than a second.
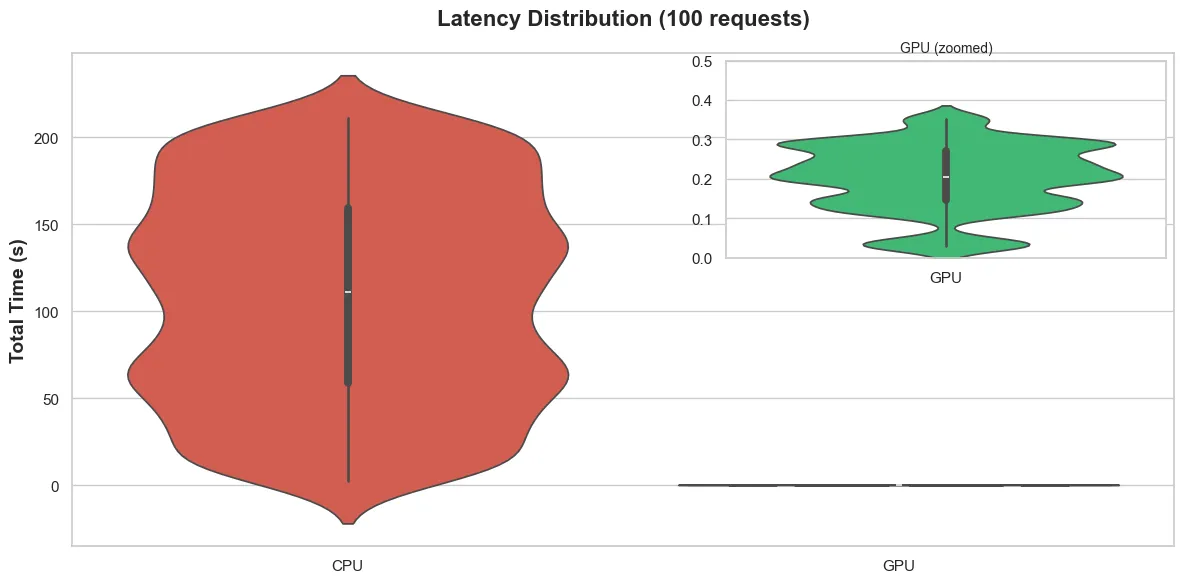
Fig. 2 Shows the distribution of time taken to process the 100 requests as measured from the TEI backends. Majority of requests to the CPU backend took the 40-180s range to process, but the early ones took less time, and the later ones took more.
The spread does show that the latency you can expect when your request joins TEI’s queue can vary significantly depending on how busy the queue is when the request arrives.
The GPU was considerably faster.
Where Time Goes to Die
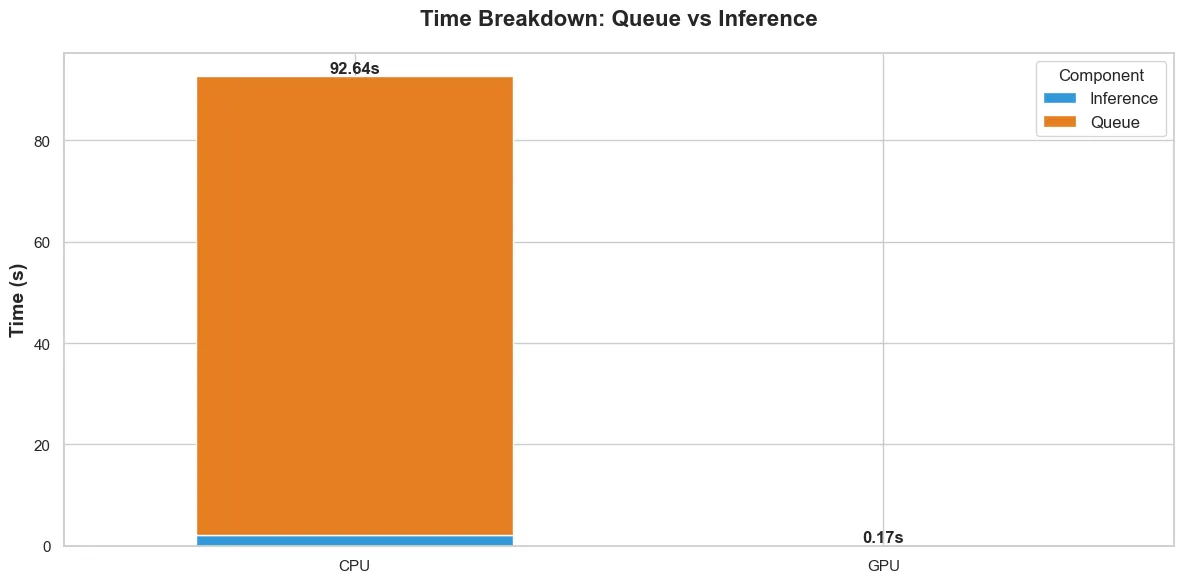
Breaking the time taken down by operation, fig. 3 shows the average time taken to handle a request internally within the TEI backends.
There is data from the GPU backend, it is just so negligible compared to the CPU backend, that it doesn’t register in the due to the scale.
For me, the CPU time breakdown is more interesting. It shows that considerably more time is spent waiting in the TEI backend queue (queue time) than actual inference (inference time).
For the CPU backend:
- Queue time (mean): 90.5s
- Inference time (mean): 2.1s
For the GPU backend:
- Queue time (mean): 0.12s
- Inference time (mean): 0.048s
Thinking about what this means practically: for the CPU backend, when a request comes in, it spends 90 seconds (on average) waiting on previous requests to finish, then 2 seconds actually doing the work. That is 97.7% of the time spent waiting.
The GPU doesn’t have this problem because it processes batches so fast that the queue never builds up.
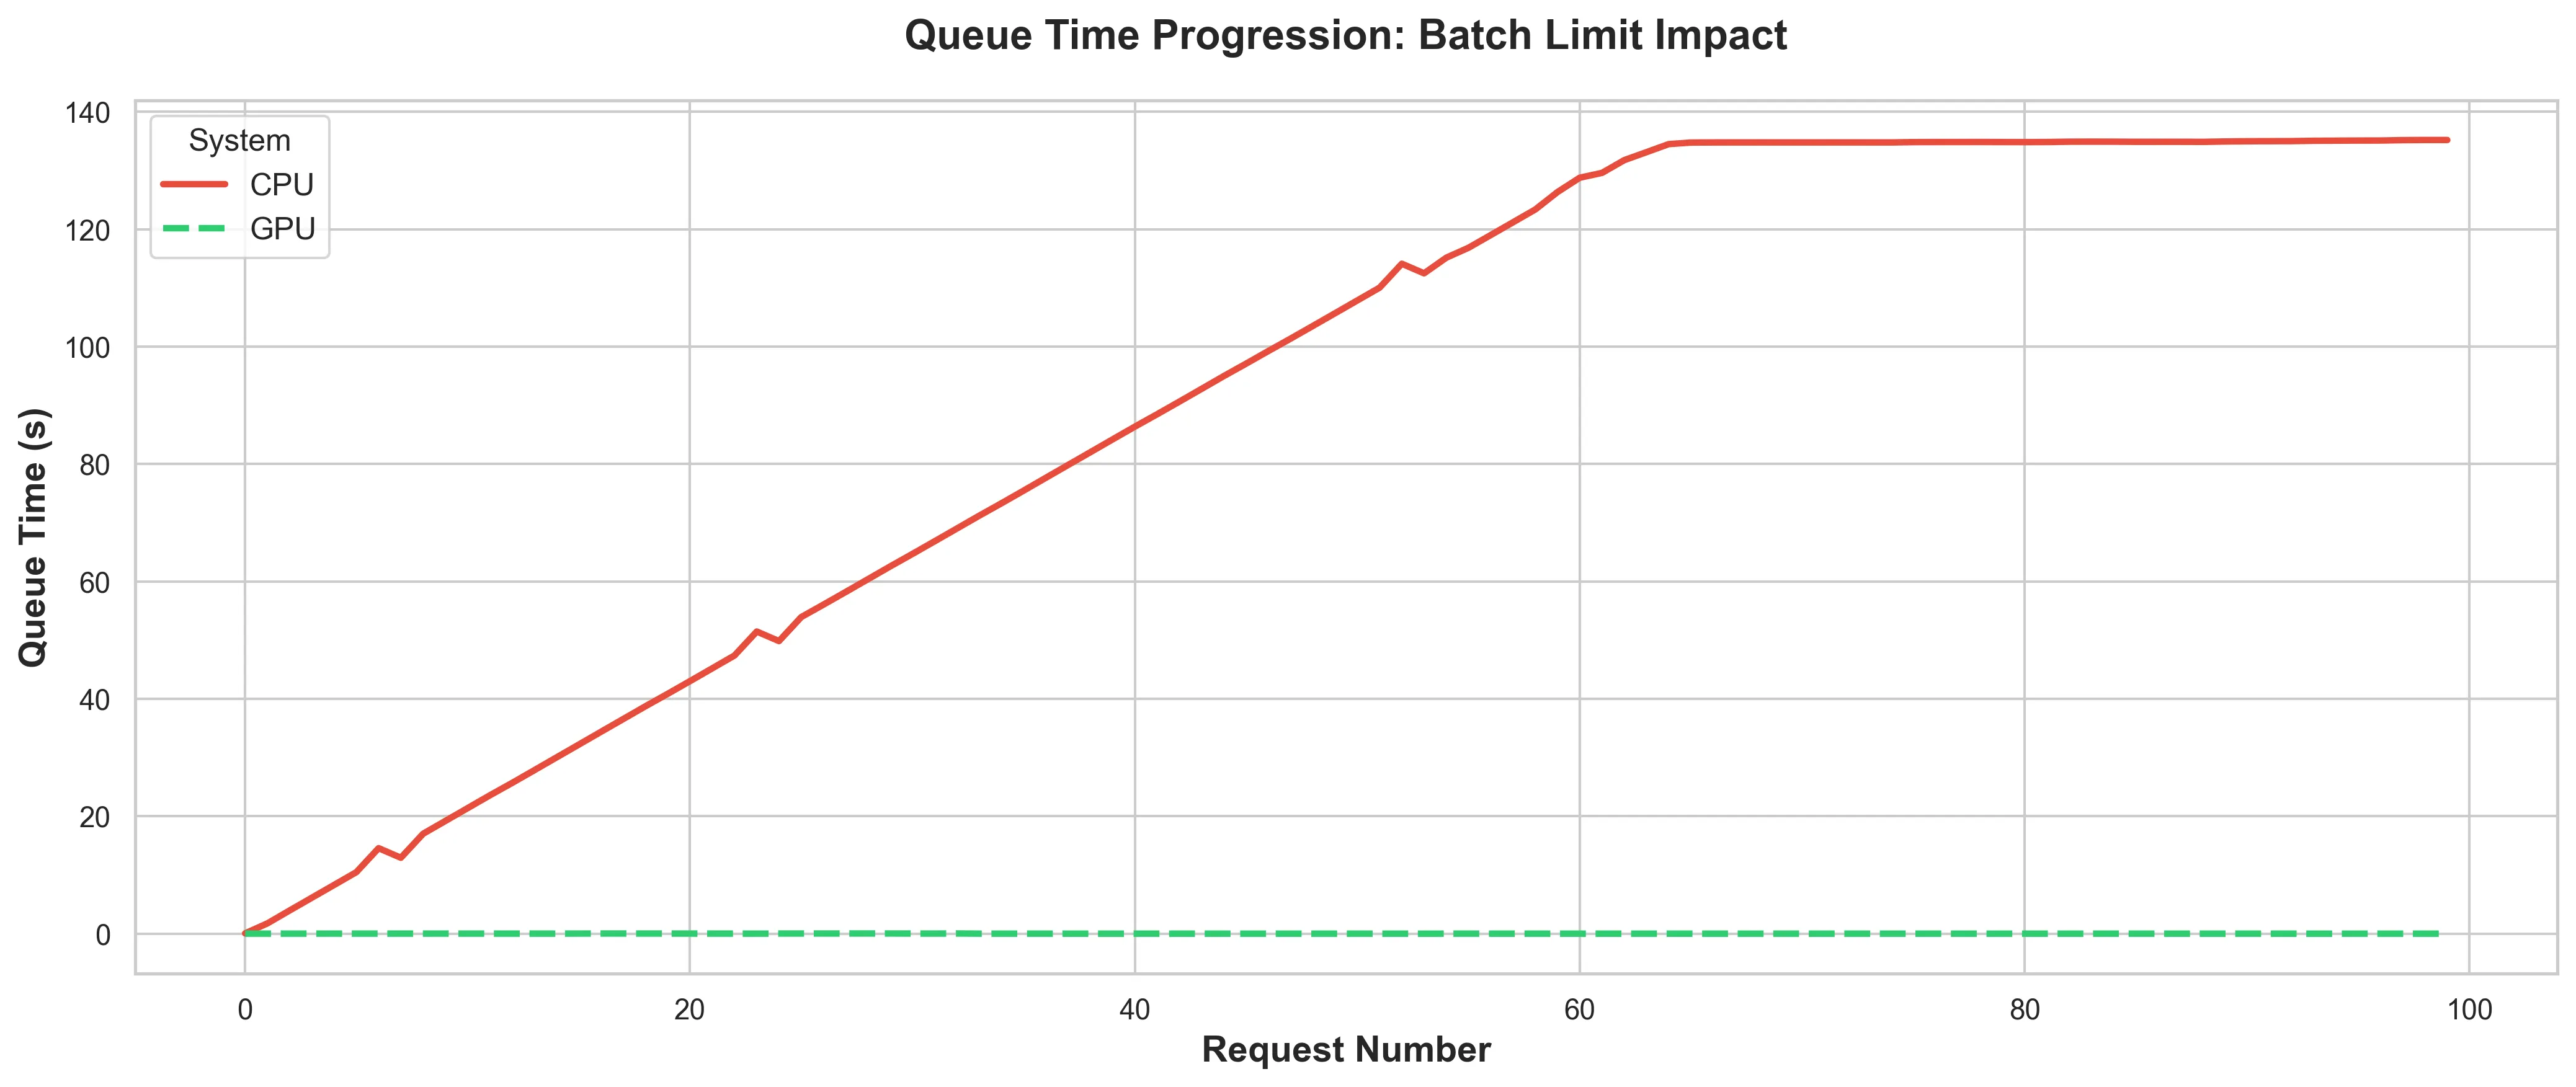
Fig. 4 shows how the queue time progresses in the TEI backend as the requests come in.
I mentioned earlier that the CPU TEI backend took about 2s to process a batch on a good day.
The “good day” is when there is no request in the queue, thus the queue time is negligible.
That is the only time when the 2s processing time I measured is possible. Which quickly became almost never.
In the CPU backend, it hits saturation at about 140s. Once the CPU backend hits saturation, any subsequent request can expect to wait for about 140s before the TEI even looks at it.
Meanwhile:
- Connections are open.
- OS resources are allocated.
- Your ingress service is holding TCP connections.
Every layer of the stack is paying the cost of these queued requests.
It should also be noted, that the aforementioned 140s excludes the time it takes the TEI backend to accept the request in the first place. Meaning when the backend’s internal queue is full, the client is left waiting for the TEI backend to accept the request into its internal queue.
The GPU Doesn’t Care (Yet)
Of course the queue progression is barely a blip for the GPU backend, because it processes so fast that there is barely a queue (see fig. 4).
This is what people think about when they say “just use GPU.” The happy path. The benchmark that gets posted everywhere.
But this benchmark is also a bit dishonest.
The Problem With Winning
What actually happens in the <1s GPU run:
- Client fires 100 concurrent requests
- GPU processes them all in a flash, so there is no queue buildup
- Everyone goes home happy
Now scale that. What happens when you have 10 users onboarding 500 documents each? That is 5,000 documents hitting the system at once. Maybe each document is at least 10 chunks. You see where I am going with this.
With the CPU backend, you already saw the problem: 216s wait time to process 100 documents that fit nicely within the batch size allowed. Extrapolate that to 5,000, and you can expect wait times measured in hours (not accounting for the variance in document sizes).
But the GPU? Quick maths:
- 1s for 100 requests = 0.01s per request
- 5,000 request x 0.01s = 50 seconds theoretical minimum
Yes, I recognise that queues are a bit more complex than that, and more concurrency tweaks can be done to increase throughput. However, assuming all 5,000 requests arrive at once, you still build a queue. The queue might only be 20–30 seconds long, but it’s a queue nonetheless.
The question however, is: where is the queue living?
As it stands, it is living in:
- Your OS network buffer
- Your HTTP server’s connection pool
- Your ingress service’s proxy layer
- TEI’s internal queue
Every one of these layers is holding open connections, consuming memory, and possibly timing out while waiting. This is fine for 100 requests because you might not hit any real latency.
Not so good for 5,000.
Actual Learnings
The benchmark showed that GPU can be up to 200x faster. Yes.
The benchmark also showed that CPU processing time is demolished by queue buildup. Certainly.
However, the benchmark didn’t show that neither approach properly handles burst traffic at scale.
When you use faster hardware, you’re not eliminating queues, you’re simply kicking the can down the road.
The question then becomes “where should the queue live?” rather than “GPU vs CPU”.
Because right now, when you send 100 concurrent requests:
- The CPU puts them in its own queue (bad: over 200s wait times)
- The GPU processes them before a queue forms (sweet: <1s total time)
- Both solutions fail when traffic increases beyond their processing capacity.
The CPU fails much earlier, the GPU requires much heavier load to fail.
The Bigger Picture
When I started this benchmark, I wanted to answer: “How much faster is GPU than CPU?”
The answer is considerably faster, obviously.
But maybe the question should have been: “How do I handle burst traffic when my processing speed can’t keep up?”
Whether your TEI takes 2 seconds or 200 seconds to process 100 requests, the fundamental problem is the same: when requests arrive faster than you can process them, you need a queue strategy.
The difference is that with GPU, you can have more breathing room. Instead of drowning at 100 concurrent requests, you might not drown till 5,000. But Davey Jones’ locker is waiting at some point.
Next: Mitigating the issue
In Part 2, I introduce a semaphore to control concurrency. Instead of letting 100 requests hit TEI all at once, we limit to 4 concurrent requests, and queue the rest in the client.
This sounds like it would make things slower, and it certainly does—just not as much as I expected.
It does however, reveal something more interesting.
There is a balance to be found between ensuring stability under load, and fully utilising available hardware.
But I am getting ahead of myself.
Want to talk about Software/AI Infrastructure?